Driving meaningful insights from vast amounts of unstructured data has often been a daunting task. As data volume and variety continue to explode, businesses are increasingly seeking technologies that can effectively capture and interpret the information contained within these datasets to inform strategic decisions.
Recent advancements in large language models (LLMs) have opened new avenues for uncovering the meanings behind unstructured data. However, LLMs typically lack long-term memory, necessitating the use of external storage solutions to retain the insights derived from data. One of the most effective methods for achieving this is through Knowledge Graphs.
Knowledge graphs help structure information by capturing relationships between disparate data points. They allow users to integrate data from diverse sources and discover hidden patterns and connections. Recent research has shown that the use of knowledge graphs in conjunction with LLMs has led to a substantial reduction in LLM ‘hallucinations’ while improving recall and enabling better performance of AI systems. Due to their flexibility, scalability, and versatility, knowledge graphs are now being used to build AI in several domains, including healthcare, finance, and law.
This article explores the concept of knowledge graphs in detail and offers a step-by-step guide to help you build an effective graph from unstructured datasets.
What is a Knowledge Graph?
A knowledge graph is a structured representation of information that connects entities through meaningful relationships. Entities can be any concept, idea, event, or object, while relationships are edges that connect these entities meaningfully.
For instance, a knowledge graph regarding Argentina’s football team can have “Lionel Messi” and “Argentina Football Team” as distinct entities, with “Team Captain” as their relationship. The graph would mean that Lionel Messi is Argentina’s football team captain.
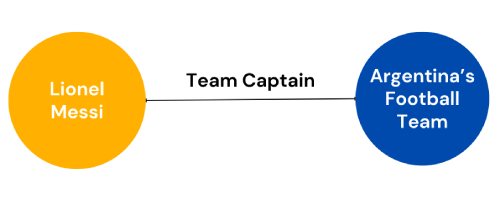
Knowledge graphs help organize information from unstructured datasets as structured relationships, using nodes (entities) and edges (relationships) to capture data semantics. Since knowledge graph databases like FalkorDB are optimized for graph traversal and querying, you can use them not only to model relationships but also to discover hidden patterns in your data.
More importantly, you can use knowledge graphs in conjunction with LLMs to build advanced AI workflows like GraphRAG. These systems enable enterprises to use unstructured data from the company knowledgebase and build LLM-powered AI systems for a wide range of use cases. In such systems, the knowledge graph stores both the data and the underlying graph, while LLMs bring natural language understanding and generation capabilities.
How Do RDF Triple Stores Differ from Property Graph Databases?
When modeling relationships in a knowledge graph, two approaches dominate: RDF triple stores and property graph databases. While both capture complex relationships, their structures and flexibility diverge in meaningful ways.
RDF Triple Stores
RDF triple stores organize information into basic units called “triples,” each consisting of a subject, predicate, and object (for example, “Marie Curie:discovered:Radium”). This system, originally built for the Semantic Web, effectively enforces consistent ontologies and standards, such as those used by the W3C.
However, representing detailed relationships with extra properties gets unwieldy. Adding attributes, such as a timestamp or context, requires breaking out more triples in a process called “reification.” Over time, simple datasets balloon into a web of triples, complicating maintenance and querying.
Property Graph Databases
In contrast, property graph databases, such as FalkorDB, take a pragmatic approach. Here, you model data as nodes (entities), edges (relationships), and properties (attributes attached directly to nodes or relationships). For example, you can have nodes for “Scientist” and “Element,” an edge “discovered,” and properties like “year” or “location” attached to that edge natively, without breaking things into granular triples.
The upshot: Property graphs feel more intuitive for highly connected data. You can easily add new relationships or enrich existing ones with descriptive details without fundamentally changing the data model. This structure suits dynamic domains where new connections and attributes frequently emerge, such as social networks, fraud detection, or enterprise knowledge graphs.
Triple stores: Best for strict ontologies and metadata, but cumbersome with detailed relationships.
Property graph databases: Prioritize intuitive modeling and adaptability, allowing you to capture rich, evolving connections exactly where you need them.
Understanding these differences helps you choose the right approach for managing and extracting insight from your organization’s knowledge graph.
Why Does Your Organization Need a Knowledge Graph?
Organizations today must manage and extract insights from extensive datasets. Traditionally, relational and NoSQL databases were used to store structured data. However, these technologies struggle with unstructured data, such as textual information, which isn’t organized in tabular or JSON formats.
To address this, vector databases emerged as a solution, representing unstructured data as numerical embeddings. These embeddings, generated by machine learning models, are high-dimensional vectors that capture the features of the underlying data, enabling searchability.
Despite their advantages, vector databases present two main challenges. First, the vector representations are opaque, making them difficult to interpret or debug. Second, they rely solely on similarity between data points, lacking understanding of the underlying knowledge within the data.
For instance, when large language models (LLMs) use vector databases to retrieve context-relevant information, they convert queries into embeddings. The system then finds vectors in the database that are similar to the query vector, generating responses based on these similarities. However, this process lacks explicit, meaningful relationships, making it unsuitable for scenarios that require deeper knowledge modeling.
This is where knowledge graphs provide a powerful alternative. Knowledge graphs offer explainable, compact representations of data, leveraging the benefits of relational databases while overcoming the limitations of vector databases. They also work effectively with unstructured data.
Consider an example of an e-commerce company analyzing unstructured data, such as customer reviews, support queries, and social media posts. While an AI system using vector databases would focus on semantic similarities, a knowledge graph would map how a user’s query relates to products, reviews, transactions, and user personas, offering a more meaningful understanding of the data.
Another example is Google, which has transformed its search capabilities through the effective use of knowledge graphs. These advanced data structures allow the search engine to understand and process queries with a level of sophistication that mimics human understanding. By leveraging knowledge graphs, Google enhances the user experience significantly. When you search for “Paris,” for instance, you’re not just inundated with links that mention the name. You get insights into its landmarks, historical figures associated with it, and even connections to cultural elements like art or cuisine. This not only makes finding information quicker but also enriches the search experience with layers of context.
Through these sophisticated structures, knowledge graphs enable Google to provide search results that are not only relevant but also insightful, transforming the way users interact with information on the internet.
In summary, knowledge graphs can help organizations build AI systems that are:
- Explainable: Knowledge graphs provide clear, interpretable relationships between data points, allowing users to understand how information is connected.
- Contextual: They model explicit relationships within the data, offering a deeper, context-aware understanding compared to simple vector similarities.
- Cross-Domain: Knowledge graphs can integrate diverse data sources (structured, semi-structured, and unstructured) into a unified representation, enabling holistic analysis.
- Searchable: By structuring relationships and entities, knowledge graphs facilitate more accurate and meaningful search results beyond pattern matching or vector comparisons.
- Scalable: They are capable of scaling with the increasing volume of unstructured data, organizing it into a structured format that’s easier to query and analyze.
- Able to Handle Complex Queries: Knowledge graphs can answer complex, multi-step queries that require an understanding of hierarchical or multi-level relationships, which relational or vector databases cannot handle as effectively.
What Is an Organizing Principle, and Why Does It Matter?
At the core of any effective knowledge graph lies the organizing principle. This principle acts as the blueprint that structures and connects data within the graph. Think of it as the “north star” guiding how information relates, whether through a simple category system or a sophisticated conceptual framework.
In practice, an organizing principle takes many forms. For example, you might use a basic hierarchy, like grouping foods into categories like “Snacks,” “Fresh Produce,” or “Seafood.” This structure makes it easy to spot relationships or traverse from broad groups to specific items. Alternatively, you might employ a formal ontology, a standardized, systematic map of all data concepts and their relationships. Ontologies maintain consistency in data classification and interpretation, which proves especially useful when data must work across different teams, departments, or systems.
While building an elaborate ontology offers power and precision, it requires significant planning and design. For most real-world projects, starting with a simple organizing principle, like a taxonomy or set of business rules, delivers value quickly. This approach keeps the knowledge graph manageable and scalable as needs grow.
Key Features and Components of Knowledge Graphs
The following sections will list and explain a few components required for building knowledge graphs. Understanding how they work will help you improve your graph depending on the nature of your data.
Entities
Entities are discrete fundamental concepts required for building knowledge graphs. They represent abstract ideas as concrete things with intrinsic meaning.
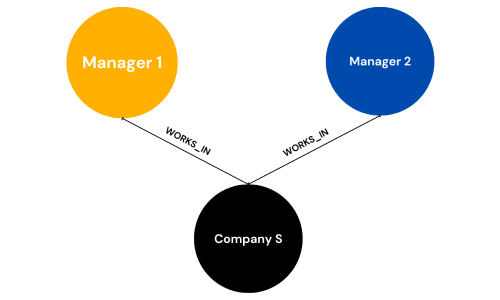
For instance, in an enterprise knowledge graph representing organizational structure, “manager” and “shareholder” can be distinct entities. Entities can also refer to names, places, and things.
Containment, Subsumption, and Composition
You can organize entities in three ways: containment, subsumption, and composition.
- Containment: When one concept can describe others, the representation is called a containment. For instance, the entity “people” can contain “managers” and “shareholder” entities.
- Subsumption: Subsumption occurs when you describe concepts using hierarchical relationships to infer concept properties. For instance, you can have an “employee” entity instead of a “manager”, since all managers are employees. The technique incorporates a specific entity into a more general category.
- Composition: Composition describes entities based on their parts. For instance, “wheels” are part of a “vehicle”. Composition helps machines to infer properties of entities through logic. In a knowledge graph, classifying “car” as a “vehicle” will allow a machine to automatically infer that a “car” must have “wheels.”
Normalization
Normalization refers to the process of removing redundancies from a knowledge graph. A knowledge graph that categorizes “works_in” and “employed_by” relationships as distinct is inefficient. Users can eliminate the redundancy by removing one of the relationships, as they both mean the same thing.
Facts
Facts in knowledge graphs represent the relationships between two entities. For example, the information “John works at Company S” is a fact as it connects two entities, “John” and “Company S”, through the “works_at” relationship.
Of course, we can improve the knowledge graph by categorizing “John” as an instance of a more general entity, and “employee” and “Company S” as instances of “Organization”. We can reify the “works_at” relationship by encoding it as an instance of “work” and connecting all employees to Company S through the corresponding “works_at” edge.
Human Limits
Visualizing an extensive and complex graph is not helpful. A better approach is to view graphs in chunks representing specific categories.
For instance, visualizing an entire knowledge graph of an organizational structure can be overwhelming for a human to process. Instead, we can categorize the knowledge graph according to departments and view each department’s graph separately to understand the connections present within them.
How to Build a Knowledge Graph in 11 Steps
The steps below offer a starting point for implementing a comprehensive knowledge graph. To ensure data quality, you can tailor these steps to your use case and knowledge base.
1. Define Clear Goals and Objectives
Knowledge graphs have multiple use cases. They can help you enhance responses from an LLM-based application, analyze internal data to improve decision-making, or optimize a search engine for better results.
Identifying the purpose will help you define clear goals and objectives for your knowledge graph. It will also allow you to model your entities and relationships in the right way. Before diving into building your knowledge graph, consider the wide range of applications it might serve within your organization. This foundational step is crucial for aligning your efforts with your strategic objectives.
Questions to Guide Your Goal Setting
- Are you planning to develop intelligent chatbots that require advanced understanding and interaction capabilities?
- Is your focus on enabling dynamic, complex research endeavors?
- Do you want to visualize or monitor asset flows and risks within your organization?
Do you aim to unlock siloed data or enhance connectivity between disparate data environments?
In summary, determining the purpose of your knowledge graph is not just a preliminary step but a strategic move that influences every subsequent decision.
2. Identify the Relevant Knowledge Domain
The next step involves recognizing the knowledge domain that your graph will incorporate. Establishing a clear domain will help you define relevant entities and relationships that you must include in the graph. It will also help you decide on the properties to associate with your entities or labels for your relationships.
For instance, a knowledge graph for an e-commerce recommendation system will have information about a user’s purchase history and demographics, the products and product categories the company offers, and the relationships between them. On the other hand, a knowledge graph for a legal domain will contain entities and relationships that make sense in that domain.
3. Data Collection and Preprocessing
After identifying the knowledge domain, you can collect data from relevant sources such as the company’s knowledge base, social media posts, public repositories, internal documents, and specific databases.
Cleaning, curating, and integrating data from all these sources is crucial for implementing an effective knowledge graph. The process includes removing duplicates and redundancies, standardizing formats, and verifying information accuracy.
With the data model finalized, prepare your data for the knowledge graph. This process builds reliability and clarity in the final graph.
Gathering and Selecting Data Sources
Identify all data sources relevant to the domain. Include structured repositories (spreadsheets), semi-structured formats (JSON, XML), and unstructured assets (text documents, emails, logs). For example, an e-commerce platform requires customer profiles, transaction records, product information, and category hierarchies.
Data Cleaning and Curation
Data preparation protects graph quality. Focus on these core tasks during curation:
Standardize Formats: Establish consistency across data types. Unify date and currency formats or harmonize text case conventions.
Deduplicate Entries: Merge or remove repeated records. Resolve entities (identifying when two customer records refer to the same individual) to prevent bloated relationships.
Address Missing Data: Manage incomplete information. Fill gaps using available context, eliminate incomplete records, or mark them for manual review.
Correct Inaccuracies: Scan for typographical errors, invalid IDs, and anomalies, then rectify them. This prevents downstream confusion during querying and analysis.
Standardizing, cleaning, and harmonizing data establishes the foundation for a trustworthy knowledge graph.
4. Semantic Data Modeling
A semantic data model is a schema for your knowledge graph representing all the entities and their relationships in a structured format.
Cypher queries can help you quickly develop a graph by letting you create relevant nodes and edges based on your initial understanding of the data. OpenCypher is an open standard for Cypher queries supported by graph databases like FalkorDB. Using Cypher queries, you can define your graph’s structure.
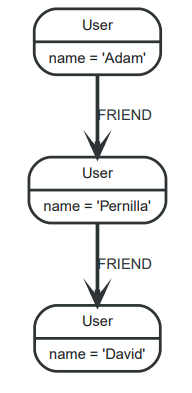
Below is an example OpenCypher query for creating a basic graph model:
CREATE (adam:User {name: 'Adam'}), (pernilla:User {name: 'Pernilla'}), (david:User {name: 'David'}), (adam)-[:FRIEND]->(pernilla), (pernilla)-[:FRIEND]->(david)
The query will generate a graph showing the relationship between different users:
5. Selecting a Graph Database
A graph DB is a platform for storing your knowledge graph. You must choose a system compatible with your existing infrastructure to scale operations quickly according to data volume.
FalkorDB is an efficient graph data management application that uses GraphBLAS to run graph algorithms. The database supports the OpenCypher query language to help you perform full-text search, compute vector similarity, and create numeric indexes for enhanced data discovery. FalkorDB is also highly scalable, and supports distributed architecture and low latency.
When selecting a graph Database Management System (DBMS), consider these key factors to ensure the best fit for your knowledge graph project:
Semantic Model Compatibility: Ensure the DBMS supports the semantic model you’ve identified. This alignment is crucial for accurately representing data-to-data relationships within your graph.
Operational Compatibility: The DBMS should integrate seamlessly with your current business operations. Consider how it fits into your existing workflow and infrastructure to avoid disruptions.
Scalability: Choose a system that can grow with your business. As data volumes and demands increase, the DBMS should be able to adapt, providing robust performance under scaling conditions.
Data Ingestion Capability: Consider how the DBMS handles data ingestion. This step is vital for shaping your knowledge graph and demonstrating data relationships effectively.
6. Data Ingestion
After installing a suitable graph DB, you must load data into the system through extract-transform-load (ETL) operations built on graph queries. To do so, you can build custom ETL pipelines where you convert unstructured data into a knowledge graph and then insert or update your graph using Cypher queries.
After installing a suitable graph DB, you must load data into the system through extract-transform-load (ETL) operations built on graph queries. To do so, you can build custom ETL pipelines where you convert unstructured data into a knowledge graph and then insert or update your graph using Cypher queries.
ETL tools play a pivotal role in this process by simplifying data ingestion. These tools, designed for Extract, Transform, and Load functions, help convert data into formats that seamlessly integrate with your graph DBMS.
Key Benefits of ETL:
Efficiency: Thanks to automation, ETL tools are significantly more efficient than manual data loading. This automation not only speeds up the process but also reduces errors.
Data Cleaning: They aid in cleaning data, ensuring that only high-quality, relevant information populates your knowledge graph.
Customization: ETL tools allow for easily customizable data loading processes, enabling tailored solutions to fit specific data requirements.
Beyond these core benefits, ETL tools play a crucial role in preparing your data for integration. Raw data can be messy, often riddled with inconsistencies, errors, or missing values. A well-designed ETL process tackles these challenges head-on:
- Standardizing Formats: Ensures that dates, numbers, and text fields are consistent across all sources. No more headaches trying to reconcile “Jan 1, 2023” with “01/01/23.”
- Removing Duplicates: Identifies and merges duplicate records, such as multiple entries for the same customer or product. ETL’s automation streamlines this “entity resolution” step, so your knowledge graph doesn’t double-count or misrepresent relationships.
- Handling Missing Values: Decides what to do with incomplete data, whether that means filling in gaps, removing partial records, or flagging them for manual review.
- Correcting Errors: Catches and fixes inaccuracies like typos, invalid IDs, or mismatched categories before they can cause trouble downstream.
By using these tools, you can effectively manage the complex task of data transformation and integration. This ensures your knowledge graph is both robust and scalable, capable of handling dynamic data inputs and evolving insights.
Validating Your Knowledge Graph Post-Ingestion
Once your initial data loads, pause and verify each stage before processing the full dataset. Start by ingesting a small sample and double-check that the structure aligns with your intended graph model.
Here is what to watch for:
Structural Accuracy: Confirm that nodes, edges, and their corresponding properties translated correctly from the source data.
Data Mapping: Review how entities and relationships map to the graph: does the data reflect the intended organizing principles?
Completeness of Ingestion: Ensure all relevant datasets populate the knowledge graph, with nothing omitted or mistakenly duplicated.
Consistency: Inspect for uniformity in data formatting, naming conventions, and relationships across the graph.
Functionality: Run basic queries to test connectivity and data retrieval, catching early misalignments.
Taking these steps catches errors before they propagate and lays a foundation for scaling your graph and extracting richer insights as your knowledge base grows.
7. Creating Schemas
A schema formalizes your semantic data model and helps you implement your knowledge graph in a structured manner. The process involves defining the vocabulary or labels you use to describe the relationship between entities.
Users often define schemas in triplets with a subject, object, and predicate. The subject and object are nodes or entities, while the predicate is the edge representing the relationship between them.
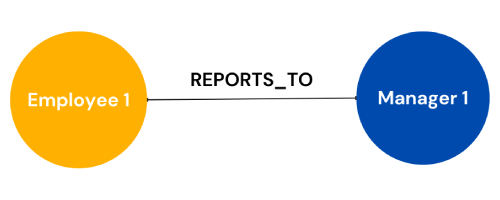
For instance, the ontology for a data model representing an organizational structure can have an employee (entity 1) and their line manager (entity 2) connected through a relationship labeled as “reports_to.”
8. Phased Implementation
A practical approach is to use a small dataset to experiment with your knowledge graph. This technique will help you quickly identify issues and understand the effectiveness of your ontology and database system. Once you have arrived at an accurate knowledge model, you can update your graph to incorporate the full scope of your dataset. The process will involve multiple iterations until you obtain the most appropriate knowledge graph to represent all the entities and relationships in the dataset.
9. Testing and Validation
After you have a suitable graph, you can test it by running queries and validating response quality. You should identify real-world scenarios and develop comprehensive test cases to evaluate the graph’s performance.
You can also validate your graph using LLMs, which can identify hidden relationships not present in the graph. Based on the new relationships, you can refine your graph and run multiple tests to ensure it provides consistent, accurate, and relevant responses.
10. Scaling Up
Once you make the necessary adjustments, you can add more data to develop a complete enterprise knowledge graph. The process may require specific access controls and integration with real-time ETL pipelines to ensure the graph remains up-to-date with the latest information.
You must also develop comprehensive documentation detailing the ontologies, domain-specific terms, and usage guidelines to ensure teams use the resource optimally.
11. Performance Evaluation
You must monitor the graph’s performance according to metrics that matter for your domain. This method will allow management to assess whether the system is achieving the stated goals and determine the reasons for lagging behind targets.
Gathering user feedback and analyzing the graph’s impact on the user experience of your AI system are some of the ways to evaluate a knowledge graph’s efficiency. You can also use emerging frameworks like Ragas to evaluate the performance of your graph-powered AI system.
12. Ongoing Optimization and Maintenance
Once your knowledge graph is live, optimization and maintenance become ongoing priorities. Regularly review the graph’s structure, query efficiency, and real-world applicability to catch areas needing refinement. This includes:
Iterative Testing: Develop new test cases that mirror evolving business needs or user scenarios. Adjust schemas and relationships as insights surface from these tests.
Performance Tuning: Monitor query response times, especially as data volume grows. Use indexing or partitioning strategies to keep retrieval fast and cost-effective.
Validation with LLMs and Tools: Leverage large language models and external frameworks to uncover hidden relationships or overlooked inconsistencies. Tools like Ragas support regular evaluation cycles.
Feedback Loops: Gather feedback from end-users and analysts to discover gaps, redundancies, or under-utilized connections in the graph.
Documentation Updates: As new domains or data sources integrate, update documentation to reflect changes in ontologies, business rules, or best practices.
Treating the knowledge graph as a living resource ensures it adapts over time, delivering accurate and relevant insights for your organization.
How to Build a Knowledge Graph from Text Data
The following steps demonstrate how to quickly develop a knowledge graph from sample text data using the Python-based GraphRAG-SDK. The FalkorDB team built the SDK on top of FalkorDB and integrated it with OpenAI to help you create robust and scalable data retrieval applications.
Step 1 – Connect to FalkorDB and Export the Open AI API Key
You can connect to FalkorDB by running its Docker container with the following command:
docker run -p 6379:6379 -p 3000:3000 -it --rm -v ./data:/data falkordb/falkordb:edge
You can also create a FalkorDB instance by signing up to the FalkorDB cloud and creating a free DB instance.
Lastly, you will need an OpenAI API key. Once you have the key, you can export it to your environment variable as follows:
export OPENAI_API_KEY=<YOUR_OPENAI_KEY>
Step 2 – Import the Libraries
Install and import the following libraries to use GraphRAG-SDK in your Python environment:
					!pip install FalkorDB
!pip install graphrag_sdk

from graphrag_sdk.schema import Schema
from graphrag_sdk import KnowledgeGraph, Source
You can use other client libraries if you are working in a different environment.
Step 3 – Read the Data
GraphRAG-SDK lets you auto-generate schema from your text data in JSON format. It helps analyze the relevant entities and relationships present in the text.
The following code uses sample data containing reviews on the movie “Matrix” from Rotten Tomatoes.
					# Auto-detect schema based on a single URL
source = Source("https://www.rottentomatoes.com/m/matrix")
s = Schema.auto_detect([source])

# Print schema
print("Auto-detected schema:")
print(s.to_JSON())
Step 4 – Manual Schema Definition
You can manually define your schema by adding or removing entities based on your data model. For instance, the following snippet only includes three entities – “Actor,” “Director,” and “Movie.”
					# Manually define schema
s = Schema()

actor = s.add_entity('Actor')
actor.add_attribute('Name', str, unique=True, mandatory=True)

director = s.add_entity('Director')
director.add_attribute('Name', str, unique=True, mandatory=True)

movie = s.add_entity('Movie')
movie.add_attribute('Title', str, unique=True, mandatory=True)
movie.add_attribute('ReleaseYear', int)
movie.add_attribute('Rating', int)

# Relations:
# 1. (Actor)-[ACTED]->(Movie)
# 2. (Director)-[DIRECTED]->(Movie)

s.add_relation("ACTED", actor, movie)
s.add_relation("DIRECTED", director, movie)

# Print schema
print("Manually defined schema:")
print(s.to_JSON())
Step 5 – Build a Knowledge Graph
You can now fit a knowledge graph on your schema as follows:
					# Create Knowledge Graph
g = KnowledgeGraph("rottentomatoes", host=host, port=port, username=username,
                   password=password, schema=s, model="gpt-3.5-turbo-0125")

# Ingest
# Define sources from which knowledge will be created
sources = [
    Source("https://www.rottentomatoes.com/m/matrix")
]

g.process_sources(sources)
Building Your Knowledge Graph with FalkorDB
FalkorDB is a low-latency, high-throughput graph database that allows users to create complex graphs for multiple use cases quickly.
The following points highlight the reasons for using FalkorDB to implement advanced knowledge graphs to gain valuable insights from your data assets.
- Low-Latency: FalkorDB query response times are 200 times faster than comparable graph databases, allowing users to scale their operations to include more extensive datasets efficiently.
- Visualization: The FalkorDB browser allows users to quickly visualize complex knowledge graphs to understand hidden relationships and data patterns.
- Integration with Large Language Models (LLMs): FalkorDB integrates with Open AI APIs, LlamaIndex, and LangChain frameworks to help you build scalable LLM-based applications. The functionality allows you to use LLM-specific features with FalkorDB’s knowledge graphs to enhance response speed and quality.
- Support for OpenCypher: FalkorDB supports the OpenCypher query language, allowing users to write Cypher queries quickly to create, read, and update knowledge graphs.
- Support for Vector Embeddings: In addition to knowledge graphs, FalkorDB allows you to convert data into embeddings and perform similarity searches to discover context-relevant information within specific data chunks.
- Scalability: FalkorDB lets you quickly host multiple knowledge graphs on different DB instances. For example, you can launch a primary FalkorDB instance and create replicas to handle read queries. You can also create multiple primary instances to host different graphs on separate servers.
Conclusion
Knowledge graphs overcome the limitations of conventional vector and relational databases by establishing crucial relationships between multiple data points. Unlike vector or relational systems, knowledge graphs help users integrate unstructured datasets from various data sources without writing extensive queries.
FalkorDB can optimize your development workflows by offering a fast and scalable database to store and process your graphs. The tool’s built-in support for mainstream LLMs, client libraries, and OpenCypher query language allows users to implement knowledge graphs quickly and boost their application’s performance.
Whether you want to build a RAG-based LLM, a recommendation system, or a robust search engine, FalkorDB streamlines the development process and allows users to scale their operations according to varying workloads.
Try FalkorDB today by installing it from its repository. To learn more about the platform, visit the website and refer to the documentation, or sign up today.
What is a knowledge graph?
How are knowledge graphs different from traditional data management systems?
What is ontology in a knowledge graph?
Build fast and accurate GenAI apps with GraphRAG SDK at scale
FalkorDB offers an accurate, multi-tenant RAG solution based on our low-latency, scalable graph database technology. It’s ideal for highly technical teams that handle complex, interconnected data in real-time, resulting in fewer hallucinations and more accurate responses from LLMs.
